


| Version 1 (modified by , 12 years ago) (diff) |
|---|
Contents
Easily Add Google Visualization charts to pages
Notice: This plugin is unmaintained and available for adoption.
Description
- uses report table for chart
- query remote data source
Bugs/Feature Requests
Existing bugs and feature requests for VisualizationPlugin are here.
If you have any issues, create a new ticket.
Download
Download the zipped source from [download:visualizationplugin here].
Source
You can check out VisualizationPlugin from here using Subversion, or browse the source with Trac.
Example
- table
- remote
Recent Changes
Author/Contributors
Author: robguttman
Maintainer: robguttman
Contributors:
Attachments (3)
- effort.png (36.0 KB) - added by 12 years ago.
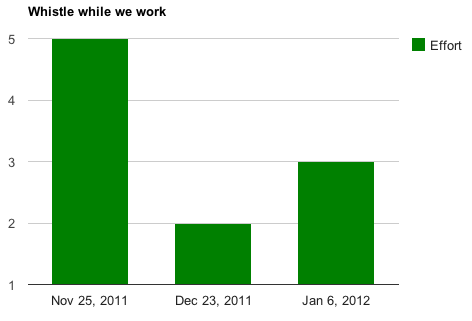
- whistle.png (12.9 KB) - added by 12 years ago.
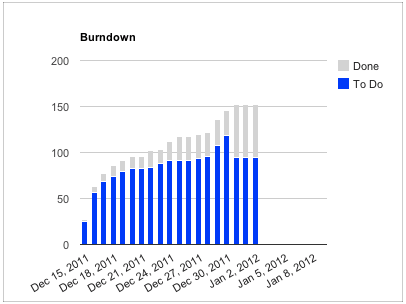
- burndown.png (22.9 KB) - added by 12 years ago.
Download all attachments as: .zip