


| Version 5 (modified by , 17 years ago) (diff) |
|---|
Plugin to render burndown SVG
Notice: This plugin is unmaintained and available for adoption.
Table of Contents
open # | new # | svn | browse
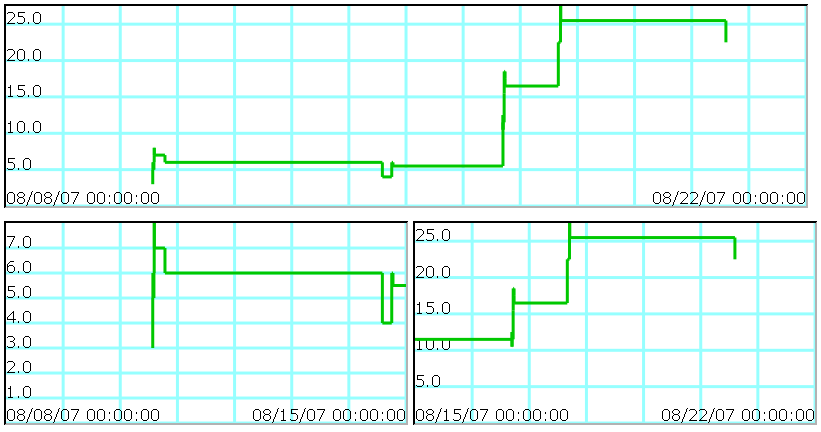
This component draws customizable burndown graphs from ticket history provided by TimingAndEstimationPlugin. Dynamic graphs can be easily embedded to wiki pages.
Status
Compability: Developed and tested with Trac 0.10.4. Should work with any 0.10 variant. May also work with 0.11.
Availability: Developed in my home computer and will be maintained most probably there. Releases will be published on this page (i could consider also svn, but refactoring filenames / file structures causes easily headache). First release will be made after I have applied proper license to the sources. There are still some issues I would like to fix before first release :)
Example
[[BurnDown(width=800,height=200,query=targetmilestone=mile1&showdates=1&datestart=08/8/07&dateend=8/22/07)]]

[[BurnDown(width=400,height=200,query=targetmilestone=mile1&showdates=1&datestart=08/8/07&dateend=8/15/07)]]
[[BurnDown(width=400,height=200,query=targetmilestone=mile1&showdates=1&datestart=08/15/07&dateend=8/22/07)]]
In my test project, the macros above render a page:

Recent Changes
- 14861 by rjollos on 2015-08-06 02:37:43
-
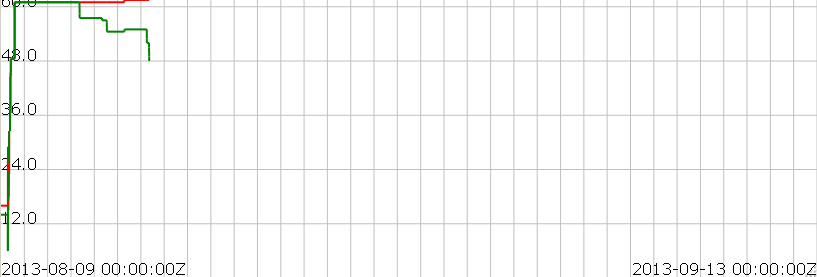
0.7: Adds support for multiple lines and makes it possible to specify the color and with of the lines and the grid.
This is an untested patch that was previously attached the project wiki page.
- 14860 by rjollos on 2015-08-06 02:37:36
-
0.7: Created branch for 0.7.
- 3323 by mape on 2008-03-07 17:01:28
-
Applied patch, which fixes logging issue with cgi frontend, closes #2666
(more)
Author/Contributors
Author: mape
Contributors:
Attachments (2)
-
TracTimeVisualizerPlugin_ss1.PNG (22.5 KB) - added by 17 years ago.
example burndowns
-
0.7_screenshot.png (15.2 KB) - added by 11 years ago.
0.7 screenshot with multiple lines
Download all attachments as: .zip