


| Version 7 (modified by , 17 years ago) (diff) |
|---|
Plugin to render burndown SVG
Notice: This plugin is unmaintained and available for adoption.
Table of Contents
Author: mape th07@…
Links: open # | new # | svn | browse
Description: This component draws customizable burndown graphs from ticket history provided by TimingAndEstimationPlugin. Dynamic graphs can be easily embedded to wiki pages.
Compability: Developed and tested with Trac 0.10.4 & Python 2.4 on Windows. Plugin might work also with 0.11.
Dependencies: TimingAndEstimationPlugin is needed to feed database with estimates and totalhours custom tickets. Browser must render SVG natively & support html tag iframe (in case of problems, try Firefox 2)
Feedback: Feel free to give feedback
Installation
- get source installation & install it
svn co http://trac-hacks.org/svn/timevisualizerplugin/0.10/ timevisualizerplugin
cd timevisualizerplugin
python setup.py install
- Edit trac.ini and modify components section:
[components]
<...other components...>
tractimevisualizerplugin.* = enabled
- Restart server to propagate changes
Usage
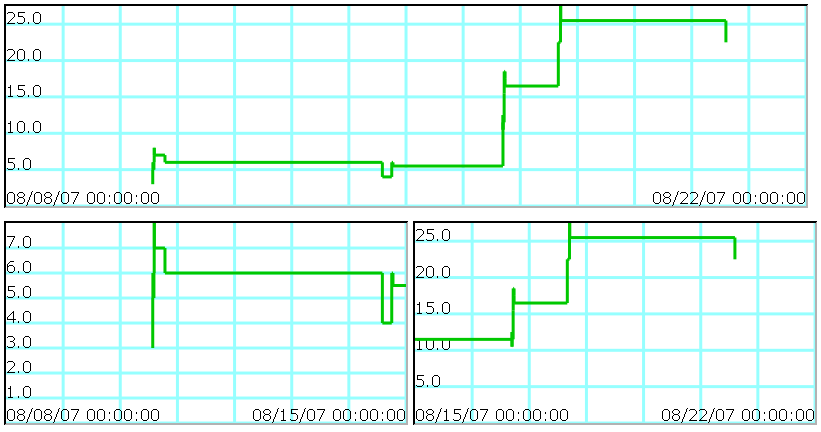
To test graphs & filtering, access "http://server:port/path_to_trac_env/tracburndownimage". It will render hours from whole project life cycle.
More practical is to get graphs from some certain time frame and filter hours based on milestone and/or component. This is achieved with macro BurnDown (ya, I wrote this plugin to replace ScrumBurndownPlugin because its graph was so limiting and I don't like plugins that modify database schema).
In my example project, I have wiki page with following content:
[[BurnDown(width=800,height=200,query=targetmilestone=mile1&showdates=1&datestart=08/8/07&dateend=8/22/07)]]

[[BurnDown(width=400,height=200,query=targetmilestone=mile1&showdates=1&datestart=08/8/07&dateend=8/15/07)]]
[[BurnDown(width=400,height=200,query=targetmilestone=mile1&showdates=1&datestart=08/15/07&dateend=8/22/07)]]
It renders the following graphs (picture is crop to fit better on this page)

Recent Changes
- 14861 by rjollos on 2015-08-06 02:37:43
-
0.7: Adds support for multiple lines and makes it possible to specify the color and with of the lines and the grid.
This is an untested patch that was previously attached the project wiki page.
- 14860 by rjollos on 2015-08-06 02:37:36
-
0.7: Created branch for 0.7.
- 3323 by mape on 2008-03-07 17:01:28
-
Applied patch, which fixes logging issue with cgi frontend, closes #2666
(more)
Attachments (2)
-
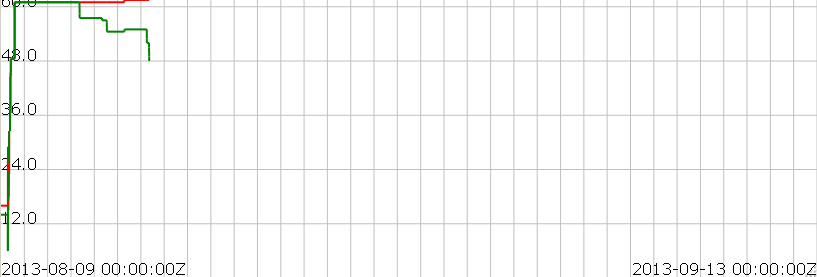
TracTimeVisualizerPlugin_ss1.PNG (22.5 KB) - added by 17 years ago.
example burndowns
-
0.7_screenshot.png (15.2 KB) - added by 11 years ago.
0.7 screenshot with multiple lines
Download all attachments as: .zip